

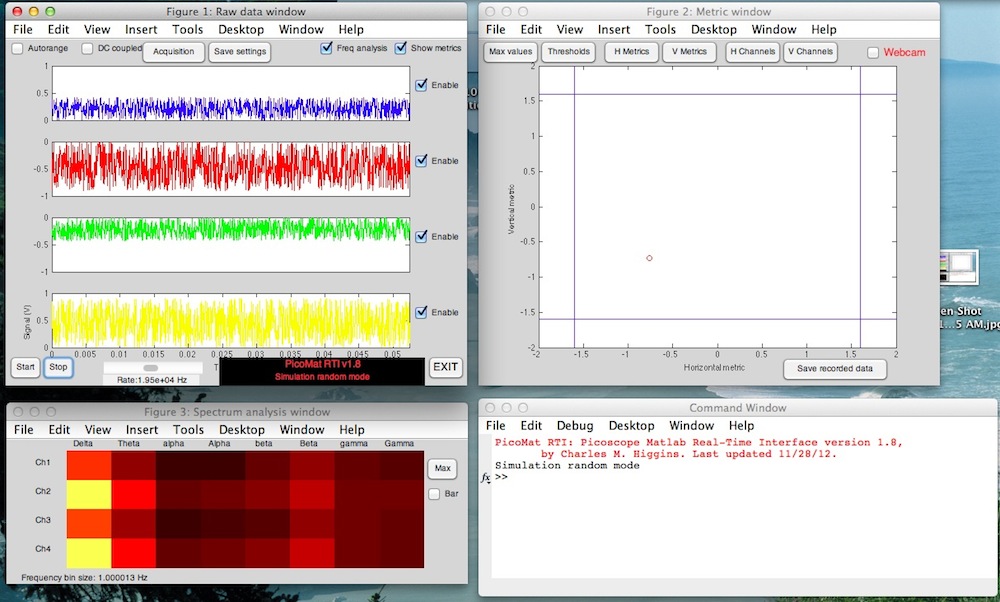
Screen shot of PicoMat RTI running on a Macintosh in Simulation random mode. The Raw data window is at the upper left, Spectrum analysis window at lower left, the Metric window at upper right, and the Matlab command window (undocked) at lower right.
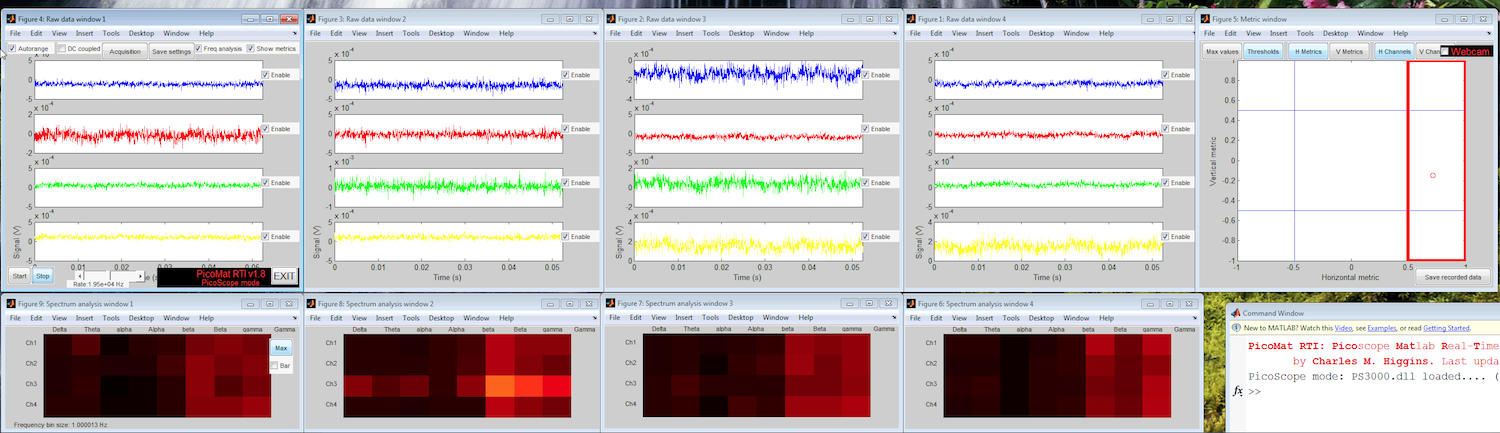
Screen shot of PicoMat RTI running on a PC with 4 PicoScopes attached. There are 4 raw data windows (16 channels displayed), and 4 EEG frequency displays. Pretty intense.
Hey, it's free software
This software is released with a BSD license. No warranty or support is provided, although you may email Professor Higgins for advice if you need it. He will help if he feels it is warranted. Have fun, and good luck. ;)The big idea
This program will allow students with little technical experience to record signals from brains and/or muscles and use those signals in real time to control a webcam. The ultimate goal is to control the pan and tilt of a webcam by thought alone.Specific purposes
1. To load data in real time from the PicoScope USB oscilloscope (specialized for the 4-channel PicoScope 3425, and can only work with 3000 series) into Matlab.2. To allow complete and flexible control of the PicoScope from the Matlab GUI, with a minimum of technical complexity.
3. To display this data in a form suitable for electrophysiology of brains or muscles, or skin conductance.
4. To process this data to determine the content of frequency bands observed in neural data (EEG in particular) and display this content.
5. To allow the user to select which aspects of the signals he/she wants to use to control the 2D position of a computer cursor.
6. To threshold the position of this computer cursor and use it to control the physical motion of a webcam.
Requirements
Matlab, which works on many platforms. Developed on release 2012a. Absolute minimum requirements are at least the Matlab core, the compiler, and the signal processing toolbox. Other toolboxes may be required, as our site license and installation includes all toolboxes. Use of the software in any mode other than PicoScope mode should work fine on a large variety of machines.Use of a physical PicoScope device plugged into USB relies on PicoTech's PS3000.dll driver , which requires Windows and is of the antiquated 32-bit variety (PicoTech seem to be resisting producing a 64-bit version). Use of the PicoScope thus requires that you use a 32-bit Windows version of Matlab.
Installation
Unzip the distribution somewhere. Put it in your Matlab path.How to use it
You can start by typing 'PicoMat_RTI' and the program will guide you from there with a graphical interface. Many errors and conditions are detected. The software has a number of modes, listed below.-
Mode 0 (Picoscope mode)
In this mode, the software loads the PicoTech DLL file, which requires that you be running on a Windows PC using a 32-bit version of Matlab. If your setup doesn't meet any of those requirements, you'll be switched to Simulation random mode, below. Otherwise, the software tries to open all available PicoScopes. The PicoTech driver only supports 4 simultaneous PicoScopes (16 channels), and the software works correctly for 0, 1, 2, 3, and 4 PicoScopes connected via USB. If you want to limit the number of PicoScopes used to less than the number connected, you can invoke the program from the command line with:
PicoMat_RTI(0, num); where num is the number of PicoScopes you'd like to use. -
Mode 1 (Simulation random mode)
In this mode, random data is created for each of the 4 available channels. This data is modulated by a sinusoidal envelope of frequency 1/5 Hz. This data allows experimentation with the 2D cursor without using real data, and is a learning tool to discover the software with predictable input. -
Mode 2 (Simulation sweep mode)
In this mode, sinusoidal data is created for each of the 4 available channels. The frequency of this sinusoid is slowly varied from 0.5 Hz to 60 Hz, up and then down. This data allows experimentation with the spectrum analysis window without using real data, and is a learning tool to discover the software with predictable input. -
Mode 3 (Recorded data mode)
This mode allows users to specify a MAT file to be loaded. This file must have been created by the PicoScope 6 program. The software will play this recorded data segment over and over in real time, as if it was being collected on the PicoScope. This mode allows users without a PicoScope to experiment with signal processing and filtering on real data. This allows one good piece of data to be used to refine processing parameters, so students are ready when they first connect up electrodes. -
Mode 4 (Audio data mode)
The software can work in "audio mode", in which stereo (2-channel) input is drawn from the local microphone or line input. In this case, the spectrum analysis shifts automatically from EEG frequencies (1-60 Hz) to audible frequencies (30 Hz - 20 KHz). This allows students to experiment with real data in real time on their own computers.
How to get out of it
Clicking the EXIT button is the best way to exit. Clicking the "close window" button (X under Windows, and the red button on a Mac) should be the same a pressing the exit button. If some figure windows won't close, you can try typing "close all force".If you are expecting to use the PicoScope, but the software complains about being unable to load drivers, you should try exiting Matlab and starting it up again. This can happen as a result of a program crash.
Errors
Please report errors and problems (particularly crashes) to Professor Charles Higgins .Details of operation
-
Saving
There are two buttons to save things in the PicoMat RTI interface. The first one, marked "Save Settings" in the Raw Data window, saves all the data collection and display settings, so they can be loaded. Every time you start PicoMAT RTI, you will be asked if you want to load settings, and can pick a previously saved file.
In the Metric data window, there is a button marked "Save recorded data". This button saves not only settings, but also the metrics and frequency data over time. This saved file can be loaded as settings, but also can be displayed using the accompanying Matlab command-line utility "plot_saved_data" (try "help plot_saved_dat" on the Matlab command line). -
Autoranging in the Raw data window
If you have the "Autorange" checkbox in the Raw data window checked, the program will automatically choose a voltage scale which fits the raw data. If you uncheck this, the current voltage scale will used. -
Autoscaling in the Spectrum analysis window
In the Spectrum analysis window, there is a button marked "Max". If you click it, you'll be presented with a dialog in which you can set the maximum for the plots made of the frequency response. If you type a number, that will be the maximum for the plot. Using this method, you can be sure you are getting a good visual comparison of earlier data with present data.
However, sometimes you are unaware what the range of the data is. If so, type "auto" in the dialog. When autoscaling, the program rapidly increases the scale if the data is above the maximum. However, if the data is well below the maximum, the program waits for about 30 seconds before scaling down. This allows autoscale to be used for dynamic data. If you press the "Max" button while autoscaling is enabled, you will see "Auto (number)" in the dialog. This number is the current maximum being used by autoscale. -
Frequencies used for EEG analysis
- Delta (1-3Hz): sleep
- Theta (4-7Hz): relaxed, meditative
- Low Alpha (8-9Hz): eyes closed, relaxed
- High Alpha (10-12Hz)
- Low Beta (13-17Hz): alert, focused
- High Beta (18-30Hz)
- Low Gamma (31-40Hz): multi-sensory processing
- High Gamma (41-50Hz)

